Tracking your baby's growth and understanding percentile lines

Growth charts are used to help check that babies are growing well. Plotting your baby's measurements on a chart allows you to see how they change over time.
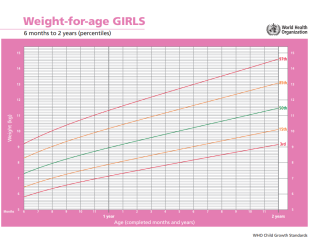
The World Health Organization (WHO) growth charts used in Australia are based on the length and weight of healthy, breastfed babies. Growth charts show how your baby grows compared with other babies.
Recording your baby's growth
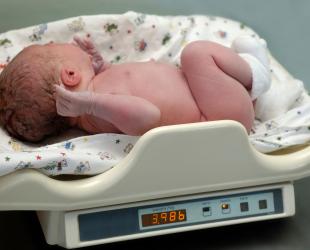
Your baby's weight is one important measure of their growth, but their length and head circumference will also increase with age.
Your baby’s health record book has charts to record all of these. Your healthcare provider will most likely measure your baby's length and the size of their head each time they weigh them. This will give you a good idea about your baby's overall growth.
View the full collection of WHO child growth standards
(including charts and tables for length/height, head circumference and older children)
How do I read a growth chart?
Growth charts can be difficult to read and understand and many people misinterpret what they see. It's the pattern of growth over time that's important, not the growth from week to week.
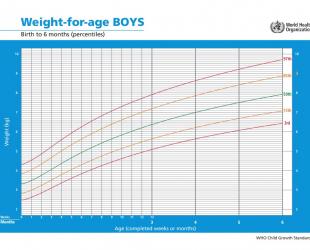
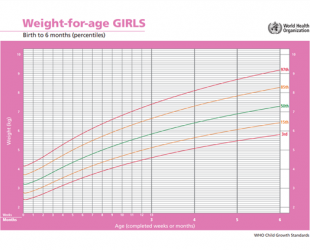
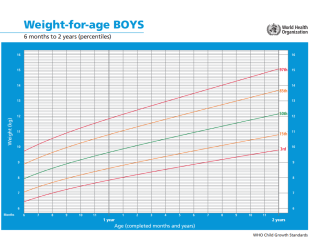
The most common type of growth chart is a percentile chart. Percentile charts allow us to compare the growth of one baby with many, many others the same age.
Understanding percentile lines
3% of healthy babies (3 in every 100) will grow below the bottom line on the chart (3rd percentile), and 3% will grow above the top line (97th percentile).
15% of babies (15 in every 100) will grow below the 15th percentile, and 15% of babies will be above the 85th percentile.
50% of babies (half) will be below the middle line (50th percentile) and 50% will be above.
Healthy babies come in all shapes and sizes. The 50th percentile line on the chart is an average, not a 'pass mark' or something to aim for. It just means that half of babies growing normally will be below it and the other half will be above.
Does my baby’s growth curve look okay?
Your baby’s growth is unlikely to follow a perfectly smooth line like those on the growth chart. Your child will grow along their own growth curve which will be marked on the growth chart each time they're weighed and measured. Sometimes this matches up with a percentile line on the chart but often it will be between two lines.
Your baby may have periods of slower or faster growth that causes them to cross over a percentile line. This doesn't always mean there is a problem. For example, a baby who is born large may have an early period of 'catch-down' growth where they put on weight more slowly than smaller babies. As children get older, they are less likely to cross percentile lines, but it does sometimes happen.
If your baby is low or high on the charts but growing steadily, it usually isn't a problem.
If your child's growth curve suddenly flattens or turns upwards or downwards (and continues that way) it's important to see your doctor or child health nurse. They can look at your child's overall growth and development to check they are healthy.
- World Health Organization (WHO). (n.d.). WHO Child growth standards. https://www.who.int/tools/child-growth-standards/standards
- The Royal Children's Hospital Melbourne. (2013). ‘Is my child growing well?’ Questions and answers for parents.
- Raising Children. (2023). Child growth charts.
© Australian Breastfeeding Association June 2025